Problem
The leadership program had been running for three years, but lacked a systematic way to measure whether it was working. Existing surveys were not designed for pre/post comparison, making it difficult to track behavioral change or connect instructional decisions to outcomes.
The program was targeting a real organizational pain point. Both managers and their direct reports had flagged the same gap: feedback culture was weak. Leaders were not regularly giving, asking for, or receiving feedback from their teams. But without clean baseline data, the team couldn't confirm which specific behaviors needed the most attention — or demonstrate impact after the program ended.
My job was to build that measurement system from scratch.
Solution
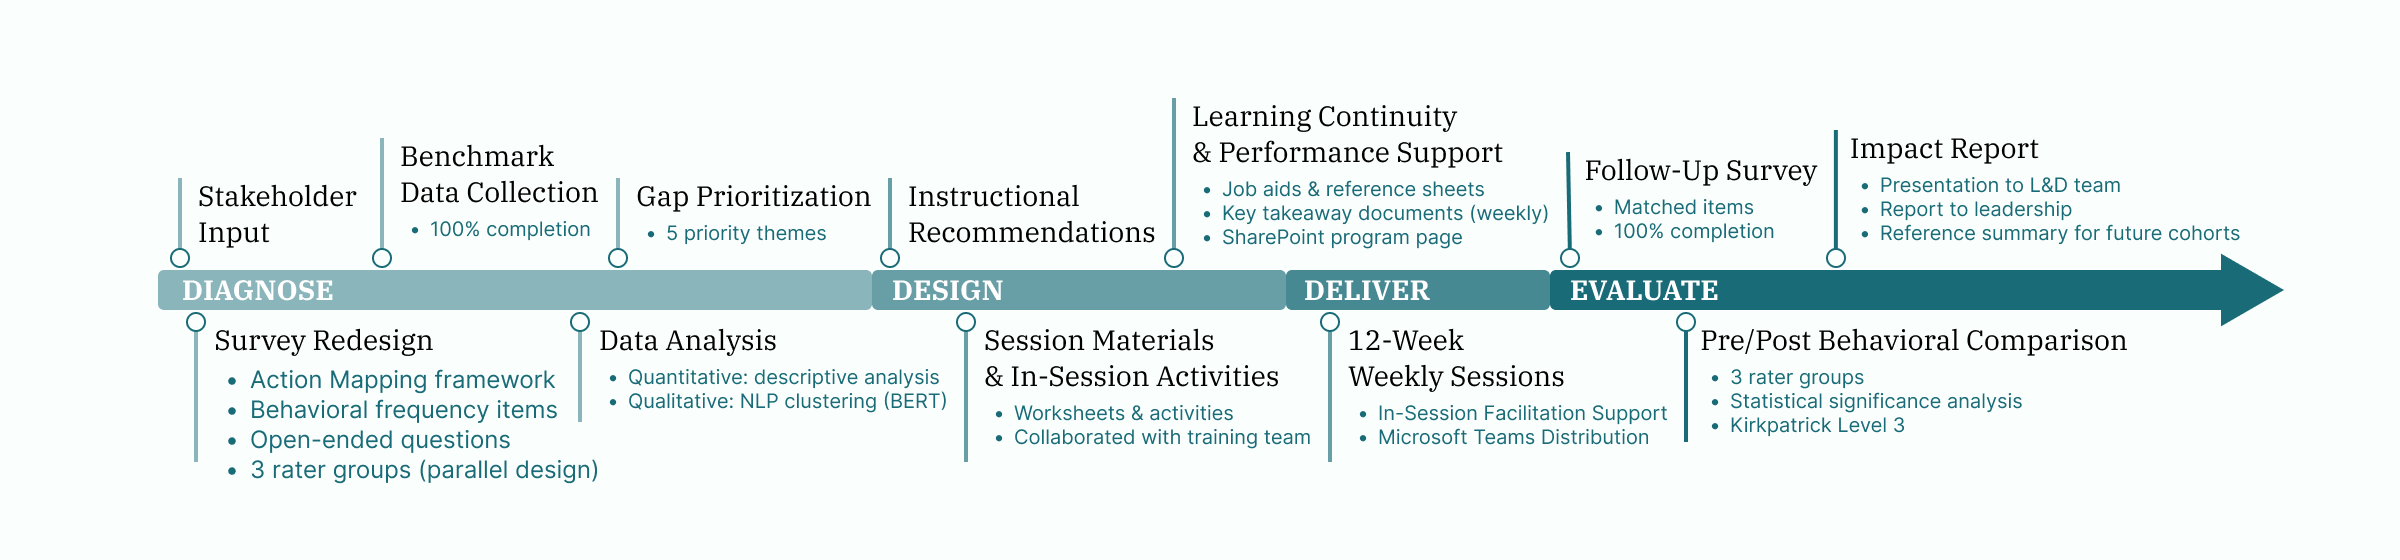
1. Redesigning the Measurement Instrument
I redesigned the survey instrument in collaboration with my supervisor and with input from organizational leadership. The goal was a behaviorally specific questionnaire that could serve dual functions — as a needs assessment at the start of the program and as a post-program evaluation — with matched items enabling direct before/after comparison.
The survey collected data from three rater groups: participants, their direct reports, and their supervisors. Each version was written in parallel — the same behaviors measured from each perspective, with question wording adjusted to reflect the rater's position. This design enabled a 360-degree view of leadership behavior and allowed us to identify not just what participants thought of themselves, but how their teams and supervisors experienced them.
2. Needs Assessment and NLP-Assisted Analysis
Once benchmark data was collected — with 100% completion across all 36 participants — I analyzed it using Python. I ran quantitative analysis on behavioral frequency items to identify the lowest-baseline behaviors across all three rater groups, then applied BERT embeddings and semantic clustering to open-ended responses to explain the patterns behind the numbers — surfacing five priority development themes that gave context to the quantitative findings.
I translated these findings into instructional recommendations for the training team — delivered as a PowerPoint summary with visualizations and a clean Excel dataset. This was a deliberate choice: early drafts in raw Python output and dense text reports weren't actionable for non-data collaborators. The goal was to make the analysis usable, not just rigorous.
Key Finding
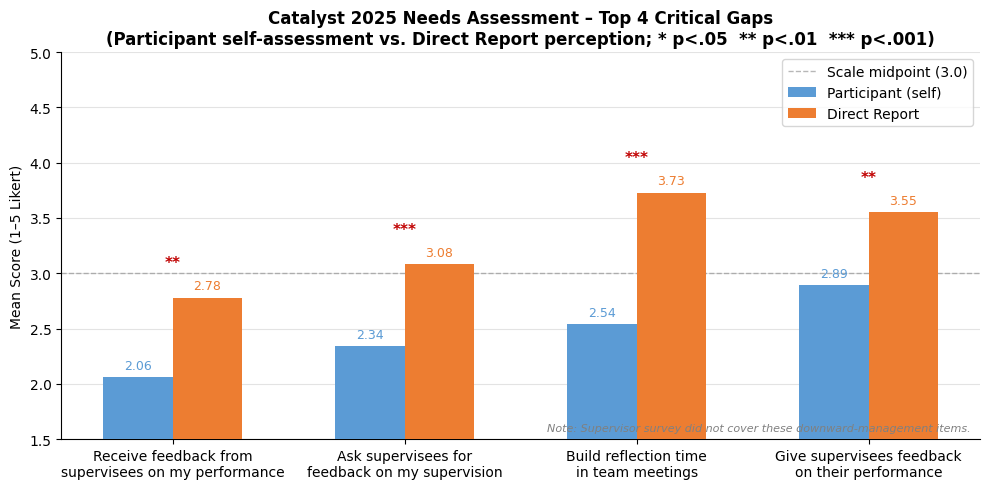
The most critical pattern was a cluster of feedback-related behaviors, all scoring between 2.0 and 2.5 out of 5. I also identified a meaningful perception gap — participants consistently underestimated their own performance relative to how their direct reports rated them, suggesting limited feedback loops rather than actual skill deficits.
3. From Analysis to Design
The needs assessment findings directly shaped what got built. With feedback culture and team building identified as the lowest-baseline areas, I contributed to session materials targeting these gaps — including a three-panel team charter reference sheet designed to help leaders establish shared norms with their direct reports, translating a data finding into a concrete facilitation tool.
To support learning beyond the sessions, I developed structured two-page key takeaway documents after each session, distilling content into tables and summaries distributed via Microsoft Teams. I also designed and wrote the program's SharePoint presence — copy, layout, and resource organization — so participants had a single place to reference tools and materials throughout the 12 weeks.
These resources were designed to extend learning beyond the session hour — reinforcing the behaviors identified as lowest-baseline in the needs assessment and giving participants something to return to between weeks.
4. Post-Program Evaluation
After the 12 weeks, I administered a follow-up survey using the same behavioral items as the benchmark, enabling direct pre/post comparison across all three rater groups. I analyzed changes in behavioral frequency scores and assessed statistical significance to determine whether the program produced measurable impact. The analysis was also packaged into a reference summary for the L&D team, designed for quick access during future program planning cycles.
Key Results
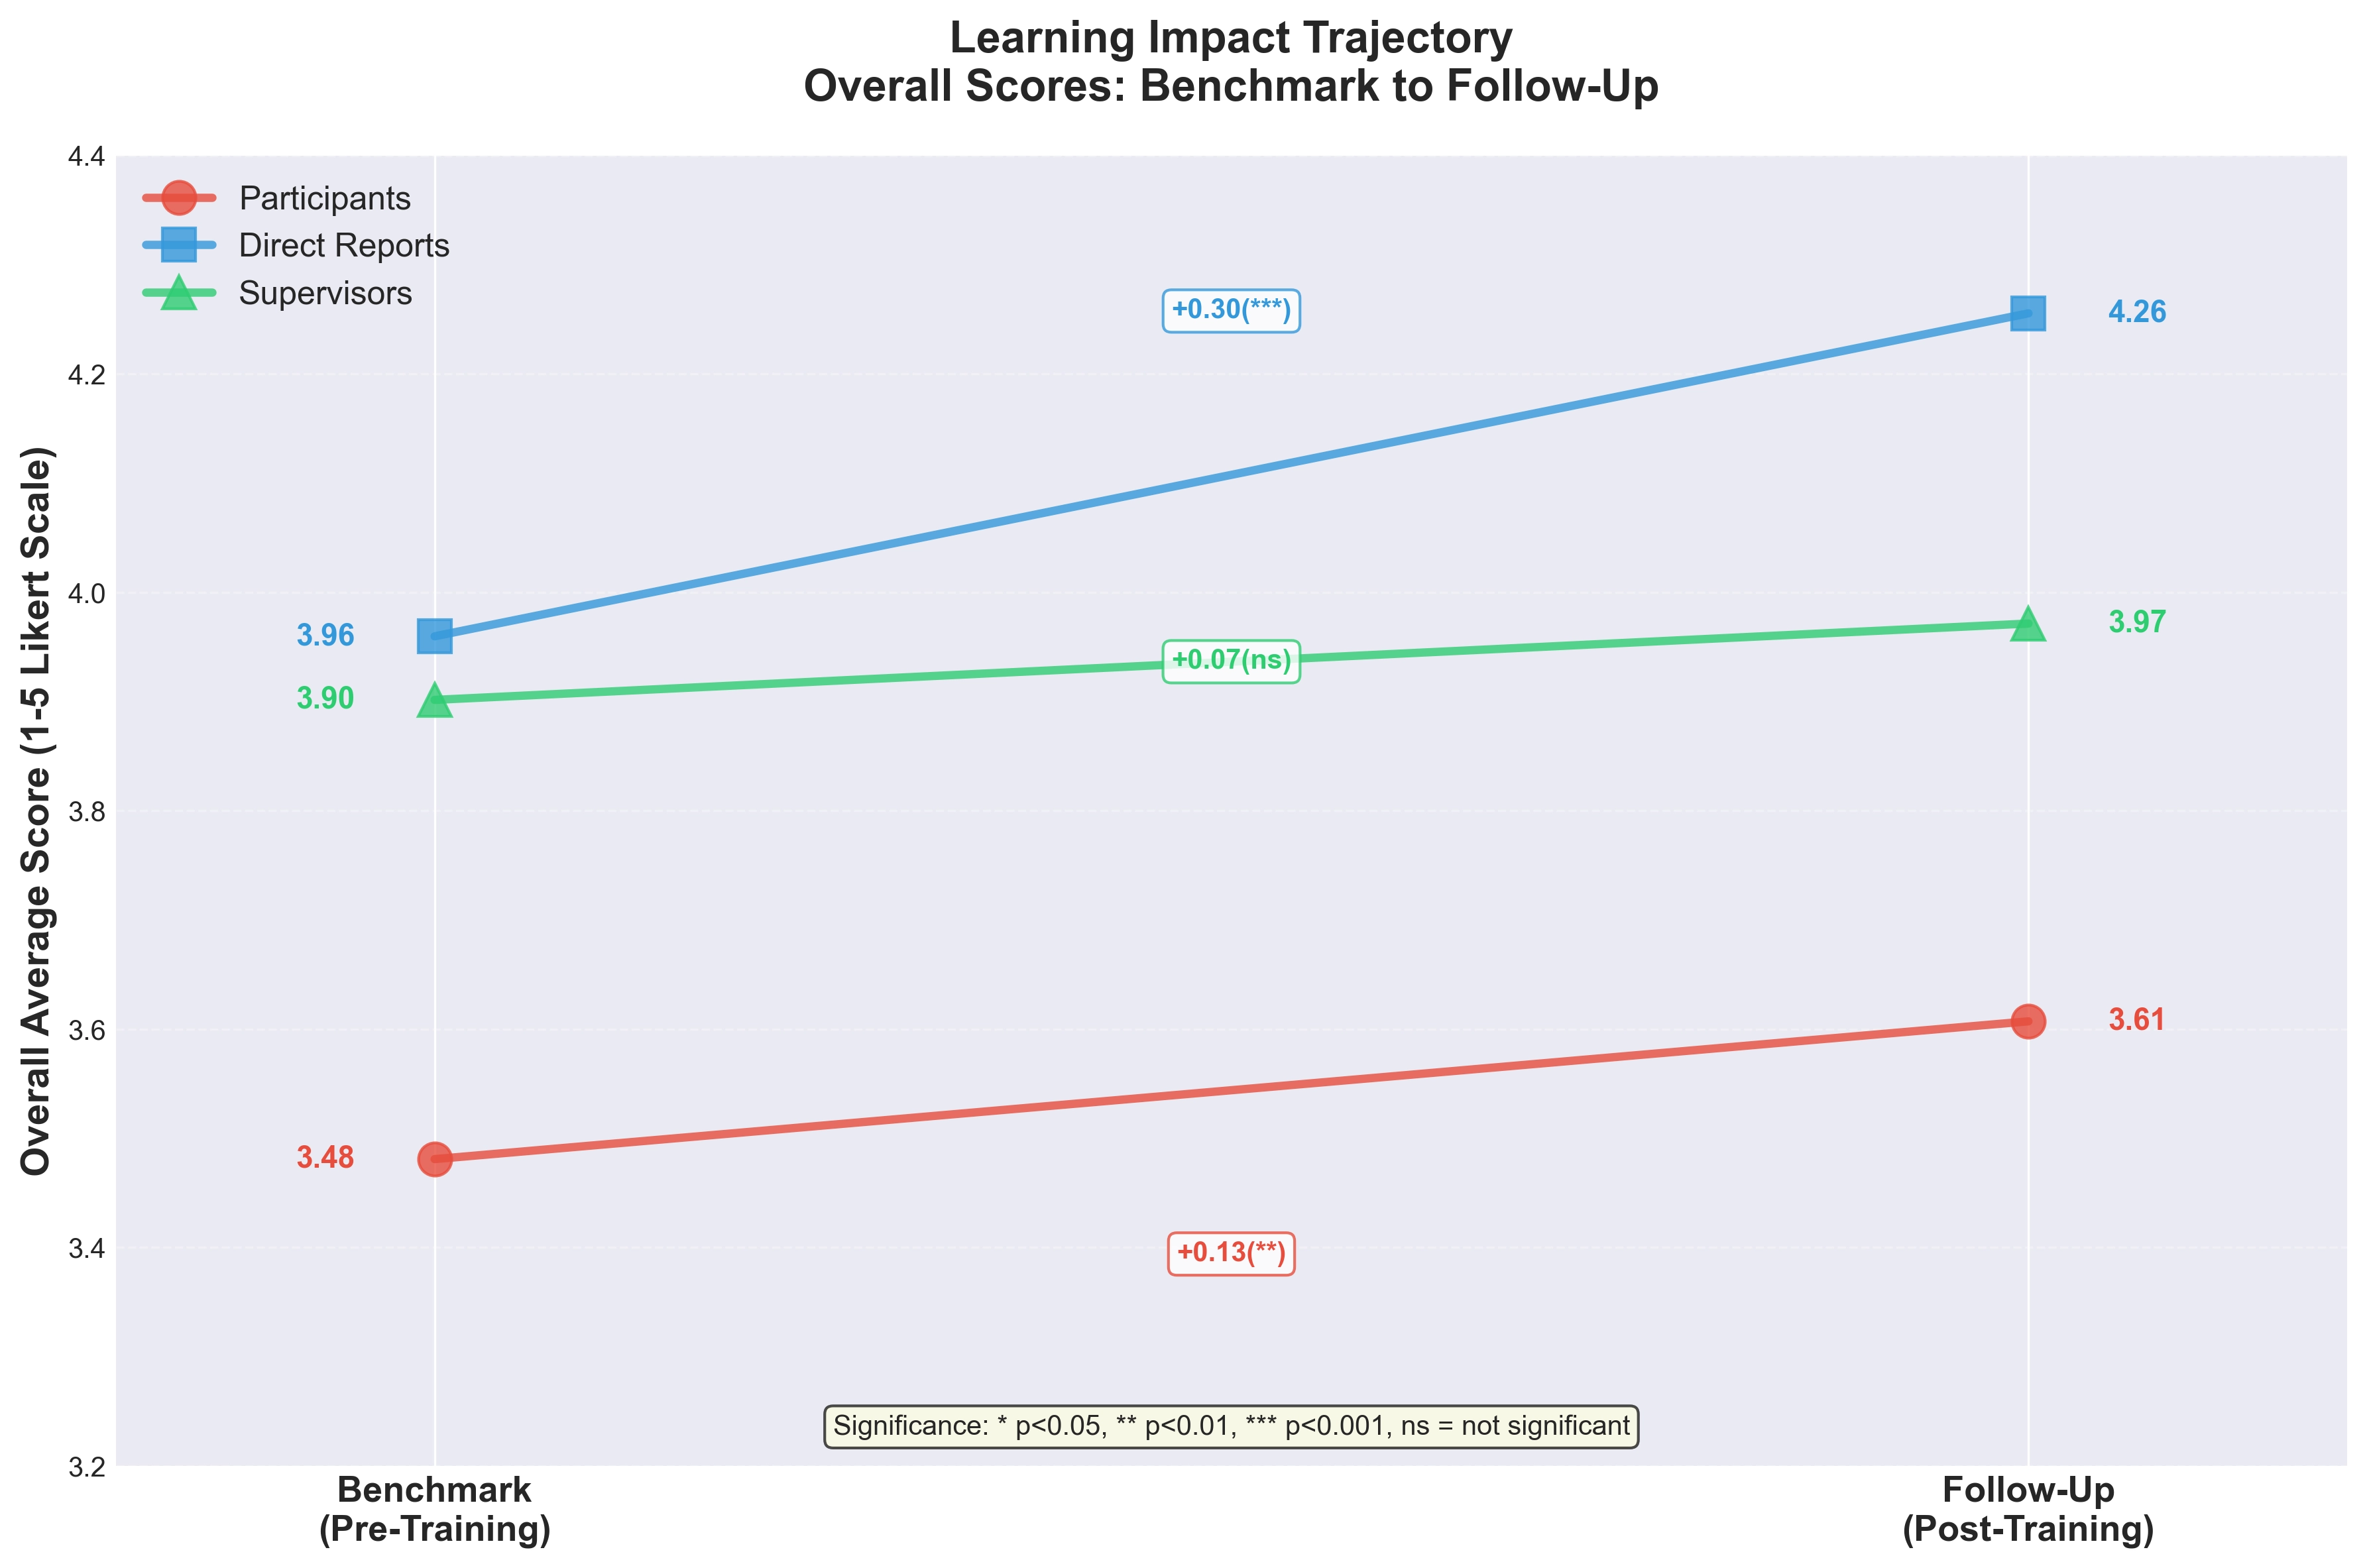
- Participants showed statistically significant improvement in the primary target behavior: receiving feedback from direct reports (2.06 → 2.51, p = 0.013)
- All feedback-related behaviors moved in a positive direction
- Direct reports reported stronger gains than participants' self-ratings — behavioral change was visible not just in self-report, but in how teams experienced their leaders
- Both benchmark and follow-up surveys achieved 100% completion
Why Measurement Mattered
The evaluation framework was designed around Kirkpatrick Level 3 — measuring not just whether participants learned, but whether they changed their behavior on the job. This distinction shaped every design decision, from the behavioral frequency items in the survey to the 360-degree rater structure that captured how teams experienced their leaders, not just how leaders perceived themselves.
Survey items were grounded in Action Mapping principles: rather than measuring abstract knowledge or attitudes, each question was tied to a specific, observable on-the-job behavior — the kind that the program was designed to change.
Findings were presented to the L&D team and submitted as a formal report to organizational leadership, providing evidence to justify continued investment in the program and informing the design of the next annual cohort.